Early Years Math Lessons
Building a Graph
Image
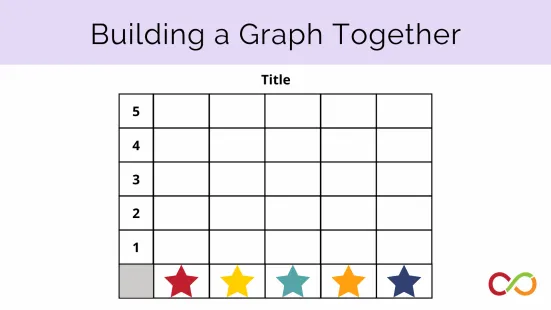
Students and their teacher review different components of a graph and build a graph together.
Circle to Bar Graph
Image

What is easier to read - a circle graph or a bar graph? Children discover the answer in this lesson.
Dice Toss
Image
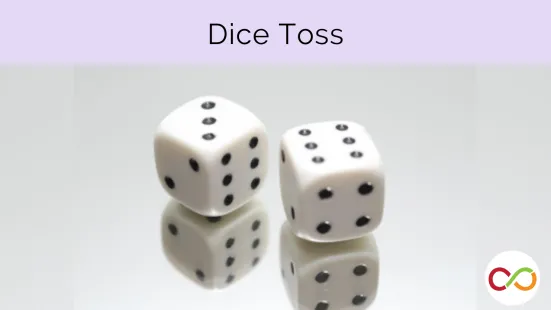
Students engage in a simple probability experiment that requires dice and mental math strategies.
Graphs on Paper
Image

Students practice precise graphing skills by using a graphing package to sort and classify objects.
Introduction to Graphing
Image
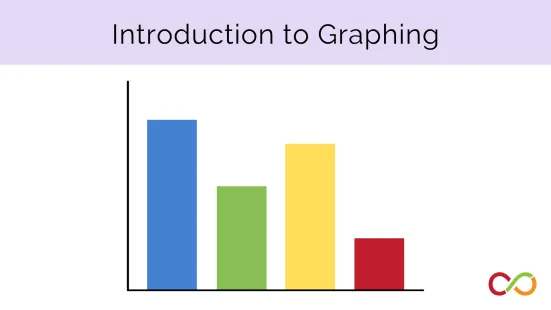
Children use previous sorting lessons to make a graph, realizing there is a clear way to display data.
Introduction to Venn Diagrams
Image
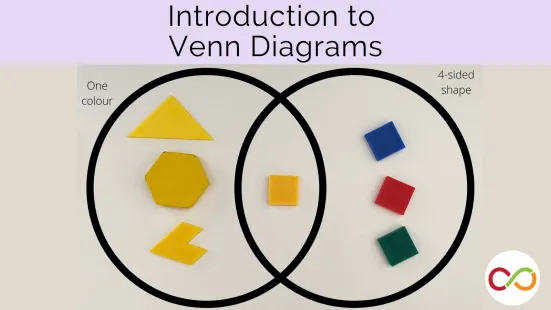
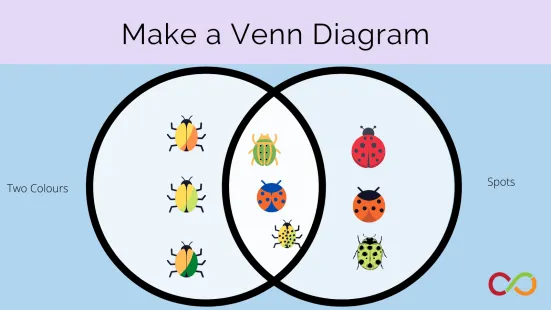
Introduce students to one of the essential hallmarks of elementary data management: the Venn Diagram.
Smarties Graph
Image
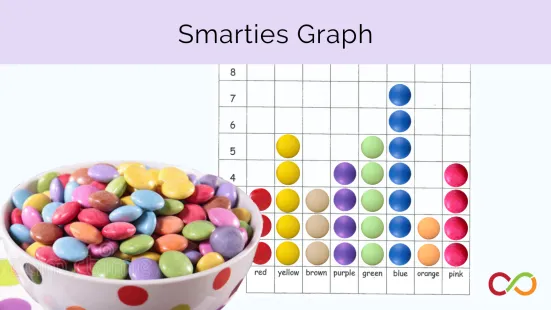
Every box of Smarties contains a different amount of each colour. Children graph what their box contains.
Sorting Apples
Image
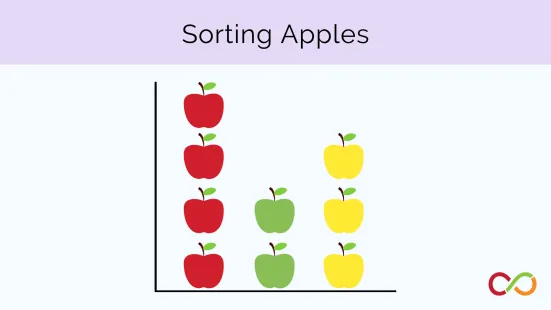
Students learn to graph using apple slices. They describe their findings using mathematical language.
Sorting Children
Image

Students organize, compare, contrast, and communicate how to sort and classify their classmates.
Using Names to Explore Graphing
Image
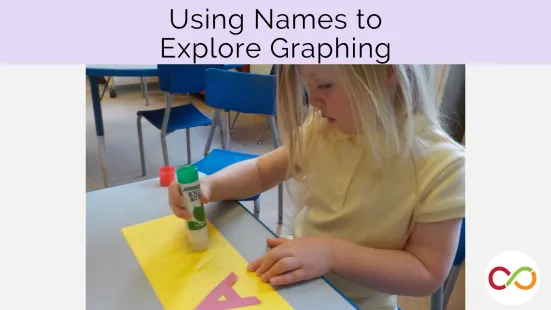
Integrate literacy and math by exploring the number of letters in each child's name.
What Colour is Your Iris?
Image
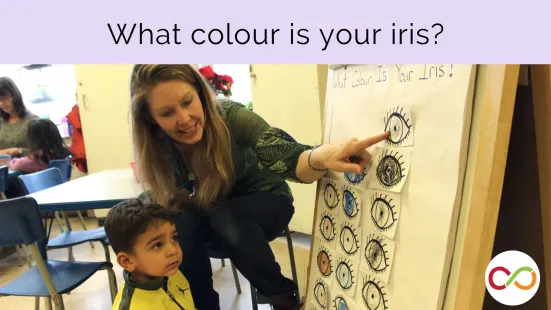
Students are introduced to graphing by observing the colour of their eye and comparing it to their classmates.
